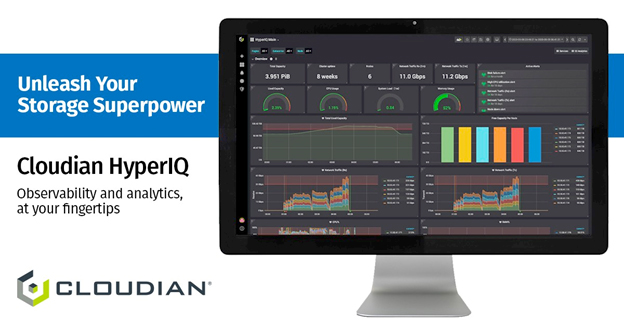
Cloudian HyperIQ™ is an observability tool for visibility and analysis of your Cloudian storage infrastructure.
In the last 6 weeks, we have worked extremely hard to roll out the features that we couldn’t include in v1.0. Here are 3 reasons why you should upgrade to v1.1.
1. OS-agnostic deployment
HyperIQ v1.0 was only released only as a virtual appliance and required virtualization applications such as VMware Workstation or Oracle VM Virtualbox to run. But, v1.1 is purely software-defined. It can be installed on any modern Linux, MacOS, Windows, or on an existing Docker deployment with a single command. For customers with dark sites, the good news is that you don’t need access to the Internet to run HyperIQ. It can be deployed within minutes in an air-gapped site too.
2. Hardware status

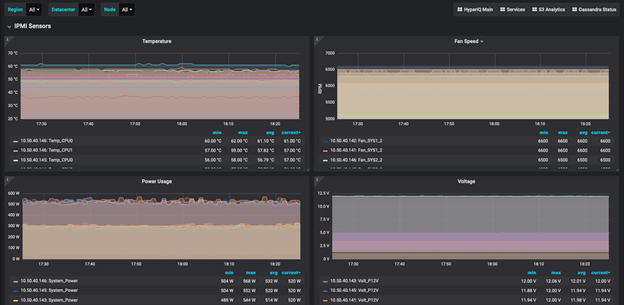
For better observability of the storage infrastructure, you need to analyze both the application performance and the hardware components. HyperIQ does both, providing you end-to-end visibility in a single pane of glass to avoid using multiple tools. New hardware sensor metrics in v1.1 let you track the temperature and voltages of various components, such as SAS expanders, DIMMs, CPU cores, etc. You can also monitor the power usage and fan speeds to make sure servers are functioning properly in your data centers.
3. Enhanced application performance monitoring

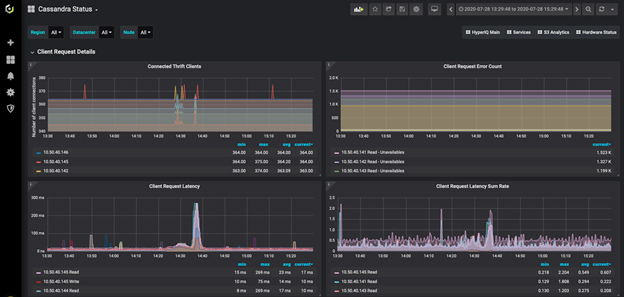
Cloudian HyperStore is native S3-compatible object storage, which means you can connect it with a variety of applications that support S3 connectivity. Typical use cases include media & entertainment, backup, video surveillance, and many more. These applications generate different file sizes and metadata associated with them. This requires an in-depth performance analysis of the storage layer. HyperIQ v1.1 now includes a dashboard to monitor the system’s database, Cassandra. Now, you can monitor Cassandra keyspaces, compactions, client requests, and other performance details. As an administrator, this helps you to understand the performance bottlenecks in your workflow and optimize storage configuration to suit application needs.
There is a lot more to come. Stay tuned!
LEARN MORE:
Visit the HyperIQ web page
View the demo
Cloudian HyperIQ Observability and Analytics Technical Demo 6:11
View the introductory video
Introduction to Cloudian HyperIQ Observability and Analytics Tool 1:55


