

Splunk is a distributed system that aggregates, parses and analyses log data. In this article we’ll help you understand how the Splunk architecture, the Splunk big data pipeline works, how the Splunk components like the forwarder, indexer and search head interact, and the different topologies you can use to scale your Splunk deployment.
This is part of an extensive series of guides about data security.
In this article:
- Stages in the Splunk data pipeline
- Splunk Enterprise vs Splunk Cloud
- Splunk components
- Putting it all together: the Splunk architecture
- Splunk Design Principles and Best Practices
How Splunk Works: Stages in the Data Pipeline
There are three main stages in the Splunk data pipeline: data collection, data indexing, and finally, search and analysis.
Data Collection
The first stage of the Splunk data pipeline is data collection. Splunk can ingest data from a wide variety of sources, including files, directories, network events, and APIs. It supports common data formats such as CSV, JSON, and XML, as well as custom formats. Data collection is typically performed using forwarders, which are lightweight agents that can be installed on any machine that generates data. Learn more in the Splunk Components section below.
Data Indexing
Once data is collected, it moves on to the indexing stage. Splunk indexes the data by parsing it into individual events and extracting relevant fields, such as timestamps, source types, and host information. This process enables efficient searching and analysis of the data later on.
Indexing can be performed on a single Splunk instance or distributed across multiple indexers for scalability and redundancy. In a distributed environment, Splunk uses an indexing cluster to ensure that data is evenly distributed and replicated across multiple indexers.
Data Searching and Analysis
After data is indexed, it can be searched and analyzed using Splunk’s powerful search language, the Search Processing Language (SPL). SPL allows users to perform a wide range of operations on the data, such as filtering, aggregation, correlation, and statistical analysis. Users can create custom reports, dashboards, and alerts based on the results of their searches and analyses.
Splunk also provides a variety of pre-built apps and add-ons that extend its capabilities and integrate with other systems, such as IT service management tools, security information and event management systems, and cloud platforms.
Read more in our guide to the splunk data model and splunk data analytics.
Splunk Enterprise vs Splunk Cloud: How Does it Affect Your Architecture?
Splunk is available in two versions:
- Splunk Enterprise – the paid version
- Splunk Cloud – provided as a service with subscription pricing
Your selection of a splunk edition will affect your architecture. This is summarized in the table below.
| Splunk Edition | Limitations | Architectural Considerations |
| Enterprise | Unlimited | Supports single site clustering and multi-site clustering for disaster recovery |
| Cloud | Depending on service package | Clustering managed by Splunk |
Note: The free version of Splunk, which was called Splunk Light, is no longer available (End of Life was May, 2021).
Splunk Components
The primary components in the Splunk architecture are the forwarder, the indexer, and the search head.
Splunk Forwarder
The forwarder is an agent you deploy on IT systems, which collects logs and sends them to the indexer. Splunk has two types of forwarders:
- Universal Forwarder – forwards the raw data without any prior treatment. This is faster, and requires less resources on the host, but results in huge quantities of data sent to the indexer.
- Heavy Forwarder – performs parsing and indexing at the source, on the host machine and sends only the parsed events to the indexer.
Splunk Indexer
The indexer transforms data into events (unless it was received pre-processed from a heavy forwarder), stores it to disk and adds it to an index, enabling searchability.
The indexer creates the following files, separating them into directories called buckets:
- Compressed raw data
- Indexes pointing to raw data (.TSIDX files)
- Metadata files
The indexer performs generic event processing on log data, such as applying timestamp and adding source, and can also execute user-defined transformation actions to extract specific information or apply special rules, such as filtering unwanted events.
In Splunk Enterprise, you can set up a cluster of indexers with replication between them, to avoid data loss and provide more system resources and storage space to handle large data volumes.
Splunk Search Head
The search head provides the UI users can use to interact with Splunk. It allows users to search and query Splunk data, and interfaces with indexers to gain access to the specific data they request.
Splunk provides a distributed search architecture, which allows you to scale up to handle large data volumes, and better handle access control and geo-dispersed data. In a distributed search scenario, the search head sends search requests to a group of indexers, also called search peers. The indexers perform the search locally and return results to the search head, which merges the results and returns them to the user.
There are a few common topologies for distributed search in Splunk:
- One or more independent search heads to search across indexers (each can be used for a different type of data)
- Multiple search heads in a search head cluster – with all search heads sharing the same configuration and jobs. This is a way to scale up search.
- Search heads as part of an indexer cluster – promotes data availability and data recovery.
Putting it All Together: Splunk Architecture
The following diagram illustrates the Splunk architecture as a whole.
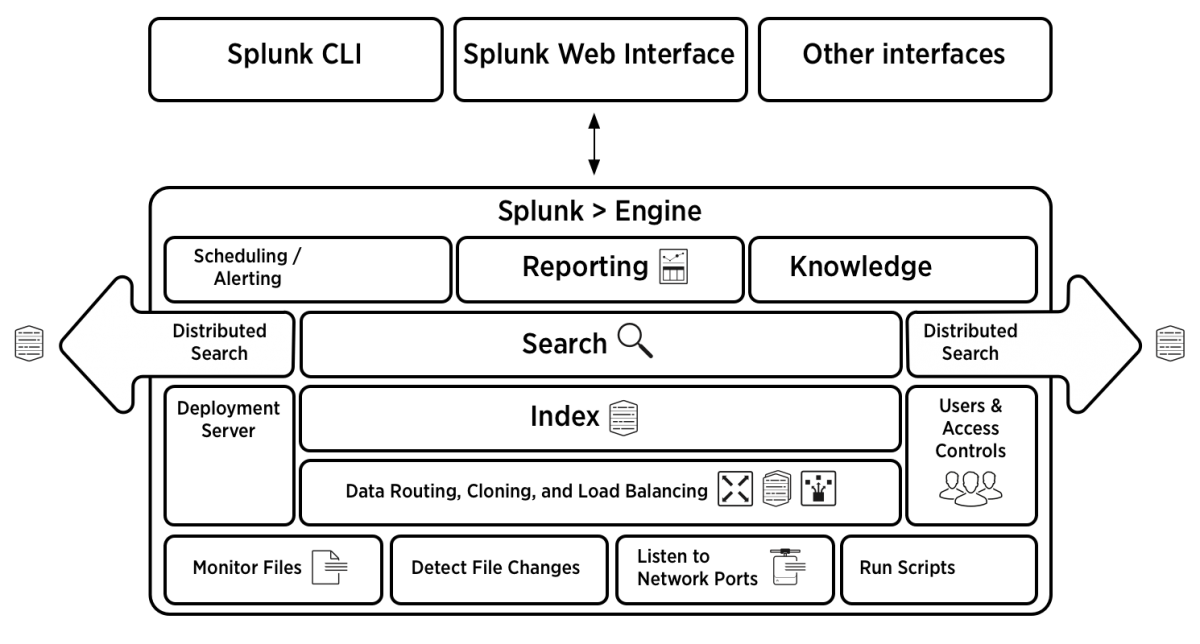
Source: Splunk Documentation
From top to bottom:
- Splunk gathers logs by monitoring files, detecting file changes, listening on ports or running scripts to collect log data – all of these are carried out by the Splunk forwarder.
- The indexing mechanism, composed of one or more indexers, processes the data, or may receive the data pre-processed by the forwarders
- The deployment server manages indexers and search heads, configuration and policies across the entire Splunk deployment.
- User access and controls are applied at the indexer level – each indexer can be used for a different data store, which may have different user permissions.
- The search head is used to provide on-demand search functionality, and also powers scheduled searches initiated by automatic reports.
- The user can define Scheduling, Reporting and Knowledge objects to schedule searches and create alerts.
- Data can be accessed from the UI, the Splunk CLI, or APIs integrating with numerous external systems.
Read more in our guide to splunk big data.
Splunk Design Principles and Best Practices
Now that we have covered Splunk architecture in detail, let’s review some best practices that will help you build the most effective architecture for your big data project.
Scalability
Splunk is designed to scale horizontally by adding additional indexers or search heads as needed. To ensure optimal performance and resource utilization in large deployments, it’s essential to distribute the workload evenly across all available components. Load balancing techniques, such as round-robin DNS, can be used to achieve this.
High Availability
In a distributed Splunk deployment, it’s crucial to ensure that data remains accessible even in the event of hardware failure or network issues. Splunk supports data replication and search head clustering to provide high availability and fault tolerance.
Security
Securing your Splunk environment is critical to protecting sensitive data and ensuring compliance with data protection regulations. Best practices for Splunk security include:
- Enabling encryption for data in transit and at rest
- Implementing strong access controls and authentication mechanisms
- Regularly monitoring and auditing Splunk activity for signs of unauthorized access or suspicious behavior
Data Retention and Archiving
It’s important to define and implement a data retention policy that meets your organization’s legal and operational requirements. Splunk allows you to configure data retention settings on a per-index basis, giving you granular control over how long data is retained and when it should be deleted or archived.
Read more in our splunk storage calculator and our guide to splunk backup.
Monitoring and Optimization
Regularly monitoring and optimizing your Splunk environment is essential for maintaining optimal performance and resource usage. Key areas to monitor include:
- Search performance and resource utilization
- Indexing performance and disk space usage
- Forwarder health and data ingestion rates
By following these design principles and best practices, you can ensure that your Splunk architecture is scalable, secure, and efficient, enabling you to unlock the full potential of your machine-generated data and drive better decision-making across your organization.
Reduce Splunk Storage Costs by 70% with SmartStore and Cloudian
Splunk’s new SmartStore feature allows the indexer to index data on cloud storage such as Amazon S3. Cloudian HyperStore is an S3-compatible, exabyte-scalable on-prem storage pool that SmartStore can connect to. Cloudian lets you decouple compute and storage in your Splunk architecture and scale up storage independently of compute resources.
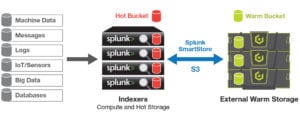
You can configure SmartStore to retain hot data on the indexer machine, and move warm or cold data to on-prem Cloudian storage. Cloudian creates a single data lake with seamless, modular growth. You can simply add more Cloudian units, with up to 840TB in a 4U chassis, to expand from terabytes to an exabyte. It also offers up to 14 nines durability.
Learn more about Cloudian’s big data storage solutionsLearn more about Cloudian’s solution for Splunk storage.
See Additional Guides on Key Data Security Topics
Together with our content partners, we have authored in-depth guides on several other topics that can also be useful as you explore the world of data security.
Object Storage
Authored by Cloudian
- [Guide] What is Object Storage: Definition, How It Works and Use Cases
- [Guide] Object Storage vs. File Storage: What’s the Difference?
- [Product] Cloudian | Enterprise-Class, S3-Compatible Object Storage Software
PCI Compliance
Authored by Exabeam
- [Guide] What Is PCI Compliance? The 12 Requirements
- [Guide] PCI Security: 7 Steps to Becoming PCI Compliant
- [Blog] Cybersecurity Threats: Everything you Need to Know
PostgreSQL
Authored by Instaclustr